Comprehensive Overlanding Consumer Research, Market Insights, and Industry Trends
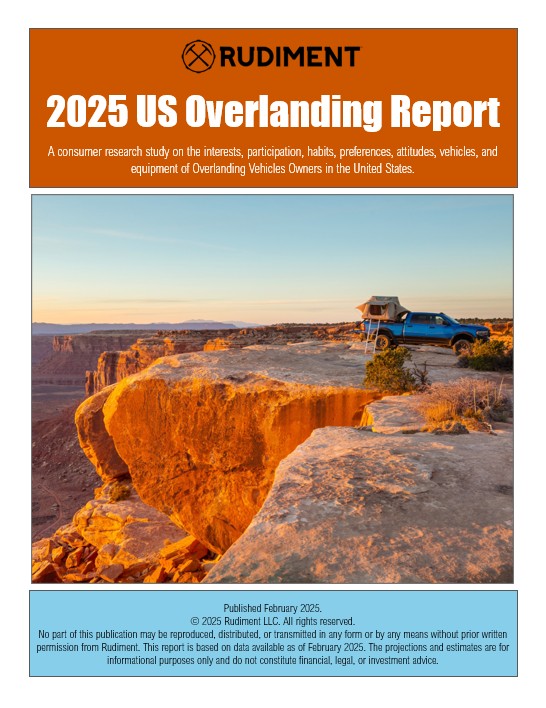
2025 US Overlanding Report
The Most In-Depth Overlanding Market Research Available
Overlanding continues to grow as a dominant sector in the outdoor recreation industry, attracting enthusiasts who blend adventure travel, self-sufficiency, and vehicle-based exploration.
The 2025 US Overlanding Report is the definitive source of data and analysis for brands, investors, and industry professionals seeking a clear, data-driven perspective on this expanding market.
This report provides deep insights into the overlanding consumer, covering market size, demographics, vehicle and gear trends, and purchasing behavior—all designed to help businesses make informed strategic decisions.
What’s Inside the 2025 Overlanding Report?
Our research delivers exclusive overlanding market intelligence, including:
- Market Size & Growth Trends – The US overlanding market is expanding rapidly, with a growing base of vehicle owners and participants each year.
- Overlanding Consumer Profiles – Get a detailed look at who overlanders are, including their lifestyle preferences, motivations, and buying behaviors.
- Vehicle & Gear Preferences – Understand which vehicles overlanders choose and how they modify them for adventure travel.
- Outdoor Activity & Travel Behavior – See how often overlanders hit the trail, how far they travel, and what influences their trip planning.
- Consumer Segmentation – Discover the distinct personas within the overlanding community and what differentiates their needs, spending habits, and brand preferences.
This is the most comprehensive overlanding research available, designed to provide businesses with a competitive edge in this fast-growing market.
Why This Overlanding Consumer Research Matters
As Overlanding continues to grow in popularity, brands and businesses need data-backed insights to stay ahead of market trends. This report is an essential resource for:
✅ Outdoor Gear & Equipment Brands – Identify key product trends and consumer demands.
✅ Automotive & Aftermarket Companies – Learn what modifications overlanders invest in.
✅ Retailers & eCommerce Businesses – Discover which overlanding-related products are in high demand.
✅ Investors & Business Strategists – Understand where the market is heading and where opportunities exist.
✅ Marketing, Advertising & Creative Agencies – Understand how to effectively target and engage the overlanding audience.
Sizing the US Overlanding Market
Our Approach: Regression Analysis
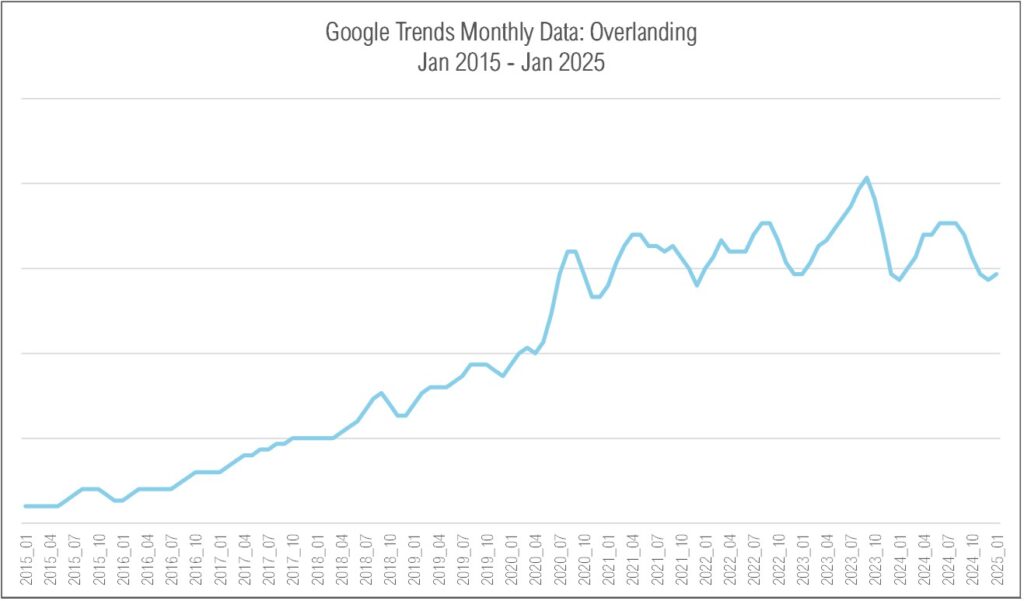
Rudiment used regression analysis to estimate the number of overlanders by examining the relationship between Google Trends data and participation rates for similar niche outdoor activities found in The Outdoor Foundation’s 2022 Outdoor Participation Trends Report. This approach allows us to quantify how search interest correlates with real-world participation, enabling a data-driven estimate of the overlanding population and a forecast for its growth through 2025.
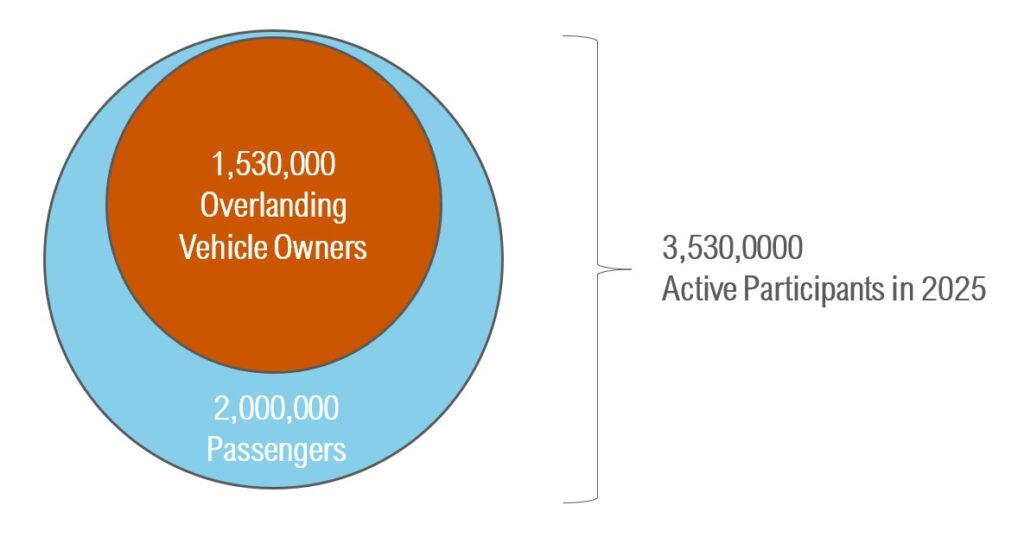
Our Estimate: 3.5M Overlanding Enthusiasts in 2025
The 2025 US Overlanding Report provides several insights into the preferences and habits of Overlanding enthusiasts. The report provides statistics on the average number of people and vehicles found in Overlanding trips.
By combining our regression analysis with data from our survey of Overlanding Vehicle Owners, we estimate 3.53 million participants in Overlanding in 2025. This is divided between 1.53 million Overlanding Vehicle Owners and an additional 2.0 million Overlanding Vehicle Passengers.

Google Trends Growth Data

Overlanding has exploded in popularity, with 3.5 million participants projected in 2025 at a 19% annual growth rate. Between 2015 and 2018, interest in Overlanding was on a gradual but steadily growth rate. Between 2018 and 2020, interest and popularity surged, bringing Overlanding into the mainstream outdoor industry conversation.
The pandemic fueled a massive spike in 2020 as people searched for outdoor activities and battled overcrowded campgrounds. By early 2021, interest peaked and stabilized at a higher baseline, signaling that overlanding’s popularity would survive the post-COVID market corrections experienced by outdoor brands.
Since 2021, seasonal trends have emerged, with peaks likely during prime travel months. Strong year-over-year growth confirms overlanding as one of the fastest-growing segments in the outdoor industry.
Methodology Statement
The 2025 Overlanding Report is a research study designed to gather insights from a verified sample of overland vehicle owners in the United States. The estimated total population of overland vehicle owners in the U.S. ranges from 1 million to 2 million individuals. To ensure statistical reliability, data was collected from 315 authenticated overland vehicle owners, achieving a 95% confidence level with a margin of error of approximately ±5.52%. By focusing on authenticated respondents, this study aims to provide meaningful and accurate insights into the behaviors and attitudes of the broader overlanding community while maintaining the highest standards of data quality.
Survey participants were recruited using a multi-channel approach targeting active overland enthusiasts who are 18 years or older, reside in the United States, and own overlanding vehicles. The recruitment process involved several phases. From October 11, 2024, to January 9, 2025, a $1,000 sweepstakes was promoted across social media platforms, offering $500 for first place, $300 for second, and $200 for third, with entry requiring survey completion. To further incentivize participation, three distinct advertisements featuring Visa gift card incentives of $5, $10, and $20 were launched on social media between October 15, 2024, and December 8, 2024. Additionally, from January 9, 2025, to February 7, 2025, three social media creators with dedicated overlanding audiences promoted the survey, offering a $20 Visa gift card to qualifying participants who completed the survey. This comprehensive recruitment strategy ensured a broad reach and diverse participation within the target demographic.
Survey data was collected using Alchemer, while additional secondary research was sourced from U.S. Census data and industry reports, including those from the Outdoor Industry Association (OIA). This secondary data provided a comparative analysis between overlanding participants, the general U.S. population, and other outdoor enthusiasts. The quantitative and qualitative analysis was conducted by Rudiment, using both internal methodologies and artificial intelligence (AI) tools to derive meaningful insights.
While extensive efforts were made to ensure a representative sample, certain biases may have been introduced due to recruitment channels. Social media recruitment could attract less experienced overlanders, as some channels are focused on educational content. Additionally, some channels had regionally concentrated audiences, potentially influencing the data to reflect geographic preferences or localized overlanding practices. As a result, while the findings provide valuable insights into the overlanding community, some data points may be regionally skewed or reflect the perspectives of overlanders with particular experience levels.
At Rudiment, we uphold rigorous data integrity standards to ensure that our research delivers reliable insights for companies in the outdoor industry. Our validation process screens out inauthentic responses, including bots, fraudulent users, or individuals outside the specified demographic criteria. For this study, 898 total survey responses were collected, of which 583 were deemed low quality and excluded from the analysis. The final dataset consisted of 315 verified responses from genuine overland vehicle owners, with 296 participants completing the 53-question survey and 19 participants completing at least 46 out of 53 questions. This quality-over-quantity approach ensures that the study’s findings are trustworthy and actionable.
Additionally, this research document incorporates data from third-party sources. While the majority of insights are derived from primary research, select historical references and comparative analyses integrate external data. All third-party sources are cited in the footnotes to maintain transparency and credibility in our findings.

